Solar trackers: 10–20% more output, at the hours that pay best

What if a solar plant produced 10–20% more energy, and delivered it during the very hours when power sells for more?
That’s what a solar tracker does. It doesn’t just lift how much you generate. It shifts production toward the moments when each kilowatt-hour is worth more.
Solar is being built fast right now, and that’s changing what the output is worth. Midday oversupply drags prices down, while value moves to the morning and evening. A tracker is built for exactly that shift.
What a solar tracker actually does
A plant’s profitability isn’t only about how much energy it produces. It’s just as much about when that energy lands, and what it’s worth at that moment. In a market like Finland’s, where power prices swing hard, timing counts for even more.
The traditional fixed-tilt plant
In a standard ground-mounted plant, the panels sit at a fixed angle, usually facing south at 25–40 degrees. Output concentrates around midday and peaks near 1 pm. Mornings and evenings are less efficient, and the low spring and autumn sun gets only partly captured.
The upside of a fixed system is simplicity: no moving parts, cheap to build, easy to maintain.
A tracker follows the sun
In a single-axis tracker, the panels sit in north–south rows and rotate on their axis to follow the sun from east to west. They face east in the morning, lie flat at midday, and point west in the evening.
The panel isn’t at a perfect angle every minute, but it tracks the sun closely enough to generate more energy over a longer stretch of the day.
How much more does a tracker produce?
A single-axis tracker typically adds 10–20% to annual energy production compared with a fixed plant of the same capacity.
A dual-axis tracker can reach 30–40% more, since the panels stay perpendicular to the sun at all times. That extra yield comes at a cost: a bigger investment, more moving parts and more maintenance, and a larger footprint. The added area per installed kilowatt also pushes up land use and lease costs.
That’s why Finland almost always settles on the single-axis tracker. It’s the best all-round balance of yield, cost, and maintenance.
The real win is in the production profile
Extra energy isn’t the whole story. A tracker also reshapes how production spreads across the day. It ramps up earlier in the morning, runs later into the afternoon, and holds up better in spring and autumn, when the sun stays low.
With a tracker, the production curve flattens and widens: the midday peak comes down a little, but more energy lands at the edges of the day. That matters financially, because morning and evening hours are often the more valuable ones. At midday, the market is awash with solar and prices drop.
The contrast is easy to see when you put a single day’s output side by side, fixed plant against tracker.
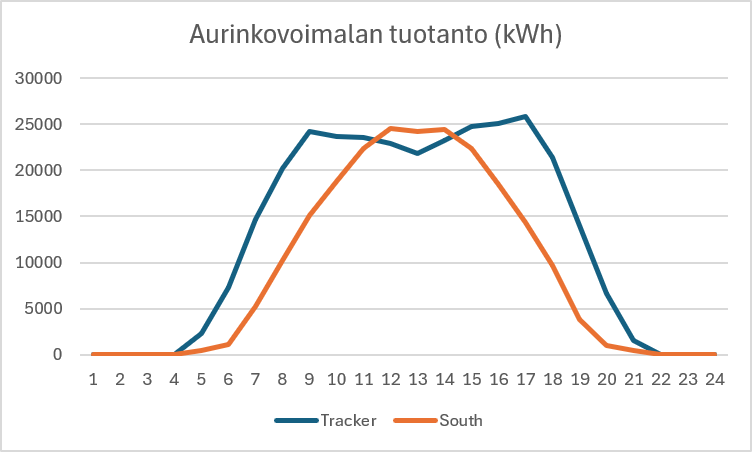
A fixed, south-facing plant (orange) delivers a narrow peak around midday. The tracker (blue) starts earlier and keeps producing later into the evening. Its midday peak sits a little lower, but morning and evening output climbs noticeably. Those are exactly the hours when power tends to be worth more, so the same energy earns a better average price.
The market is moving in the tracker’s favor
Across Europe the direction is clear. The more solar that joins the grid, the steeper the so-called duck curve gets: midday prices fall sharply, while morning and evening prices climb. In Germany it already shows in the numbers. Negative wholesale price hours rose from around 300 in 2023 to around 460 in 2024, and to nearly 575 in 2025. Most of them hit midday in the summer months, when solar output peaked. In May 2025, the price briefly dropped to roughly -250 €/MWh. (Source: FfE: German electricity prices on the EPEX Spot exchange in 2025; Fraunhofer ISE.)
This effect is sometimes called cannibalization. It means midday production on its own is no longer the best you can do. A tracker keeps generating outside the midday window, which lifts the value of what it produces.
We’re already seeing the same shift in Finland, even if negative prices here have come mostly from wind so far. Spot power is at its cheapest in summer, and negative hours are stacking up more often. Solar here also generates into the midday and afternoon, while demand and the higher prices sit in the morning and early evening. Solar capacity is climbing fast, too: according to Fingrid, far more new solar was connected to the grid in the first nine months of 2025 than a year earlier. The more that comes online, the harder midday prices will fall here as well. You can follow live production and price data through Fingrid’s open data.
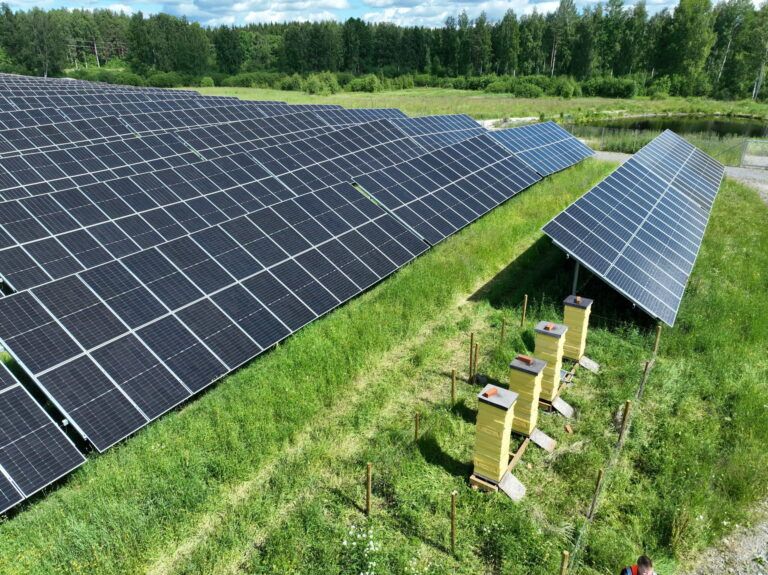
A real example: the Satarehu plant in Huittinen
This is where theory meets the field. At the Satarehu feed mill in Huittinen, Solarigo is building what will be Finland’s largest sun-tracking solar plant on a commercial property. A single-axis tracker turns the panels from east to west, and the same plot of land delivers clearly more than a fixed setup would.

The plant comes in at around 867 kWp, with an estimated 970 MWh a year, enough to cover roughly 15–20% of the mill’s annual electricity use. That’s about 20% more than a fixed plant of the same size would produce. Its 1,304 panels fit on about one hectare, so the extra yield comes without taking up any more land.
For Satarehu, two things come together. CEO Jarkko Jokinen points out that in the food industry, sustainability is an ever stronger competitive factor, and on-site generation also buffers the business against swings in the energy market. Solarigo’s project manager Leo Naukkarinen puts the technical case simply: a tracker maximizes output in the morning and evening, when power is often worth more than at midday, and it does so without needing any extra land.
The project is on track. The building permit is in hand, and the plant is set to go live in autumn 2026.
See the project: Satarehu solar plant
When does a tracker pay off?
The economics rest on the same building blocks as any solar plant: the total investment, the energy produced, the value of that power, and the operating and maintenance costs. A tracker adds cost, but it also raises output and improves its timing.
For scale: a roughly 1 MWp tracker plant generates about 1 GWh a year. For it to make sense, you want to put a solid share of that energy to use on-site. In practice, that points to summer daytime demand in the region of 500 kW or more.
A few other factors weigh in: how suitable the terrain is, since a tracker needs better foundation conditions; how precise the installation is, since the axis has to stay within tolerance; and any shading or production limits on the site.
Where trackers fit best
A tracker is at its strongest for companies with land to spare outside the city center, at sites with steady daytime electricity use, and in sectors where demand peaks in summer, such as anything that relies on cooling.
In solar parks, trackers are often the easy choice: space is less of a constraint, and the system can be optimized for the job from the start. They don’t suit rooftops, and below roughly one megawatt they rarely add up financially.
What about Finnish conditions?
The big difference from a fixed plant is the moving mechanics. The risks center on component durability, on how the hardware holds up in Finnish conditions, and on installation quality and tolerances. Long-term experience with trackers in Finland is still limited, since these systems were originally designed for sunnier, southern climates.
We manage that with careful design, solid component choices, and plenty of piloting and testing. In practice, we trial different foundation methods within the same plant, compare component options in the field, and learn from our own projects and others’. For the customer, none of this makes the plant harder to run, since operation and maintenance come as a service.
The investor’s view
For an investor, the math is simple. The investment goes up a little; the returns go up more. The result is better profitability, which often makes a tracker project the more attractive option next to a fixed one.
Part of a bigger picture
Solar on its own, tracker or not, won’t cover a continuous baseload need. What a tracker does is sharpen the production profile and make solar a stronger piece of the whole. Paired with wind and battery storage, it helps build a steadier, more predictable energy system.
In short
A fixed plant packs its output into the middle of the day. A single-axis tracker generates 10–20% more energy a year and spreads it more evenly across the day. A dual-axis tracker reaches 30–40% more, but at a higher cost and with a larger footprint.
In the end, profitability doesn’t come from the technology alone. It comes down to how well the whole system is designed and built, with Finnish conditions and the energy market in mind.

Thinking about a tracker for your site?
If you’re wondering whether a tracker would work for you, let’s start from your numbers: the land, the consumption profile, and what you want to achieve. We’ll map out together what it would mean for your output and your business case.
Ville Vairinen
CTO